

U.S. GDP growth reached a 3.4% annual rate in the third quarter of 2026, according to the Bureau of Economic Analysis (BEA). On the same morning, the agency reported that September consumer spending increased 0.5% in current dollars but less than 0.1% after adjusting for prices. The two results are not contradictory. They describe different periods, use different units and illuminate different parts of the economy.
The October 29 advance GDP estimate measures economy-wide real output during July through September at a seasonally adjusted annual rate. The September personal income and outlays report measures changes from August to September, including prices and households' spending. Reading them together produces a more useful question than whether the economy is simply strong or weak: which activity grew, over what period, and how much of a dollar increase represented additional purchases rather than higher prices?
What the 3.4% U.S. GDP growth figure actually means
The 3.4% GDP headline is an annualized change in inflation-adjusted output between the second and third quarters, not a claim that the economy expanded 3.4% between July and September alone. BEA reports the corresponding quarter-to-quarter real increase as approximately 0.8%. Annualization asks what a quarterly pace would imply if repeated for four quarters; it is a reporting convention, not a forecast that the same pace will continue.
BEA estimates real GDP grew at a 2.2% annual rate in the second quarter. The latest 3.4% figure therefore represents an acceleration of 1.2 percentage points in the reported annualized growth rate. That difference is not a 1.2% increase in the level of GDP and does not tell us how much a typical family's income rose.
According to BEA, investment, consumer spending and government spending contributed to third-quarter growth, partly offset by lower exports. Imports increased, and because imports are subtracted in GDP accounting to avoid counting foreign production as domestic output, that increase affected the headline calculation. It would be misleading to interpret the import subtraction as proof that all imports are economically harmful.
Why September spending tells a more cautious story
The monthly report shows current-dollar personal consumption expenditures (PCE) increased by $113.1 billion in September, or 0.5% from August. Of that dollar increase, $35.1 billion was attributed to goods and $78.1 billion to services. Those are changes in the national aggregate at the agency's published reporting scale, not the spending of an average household.
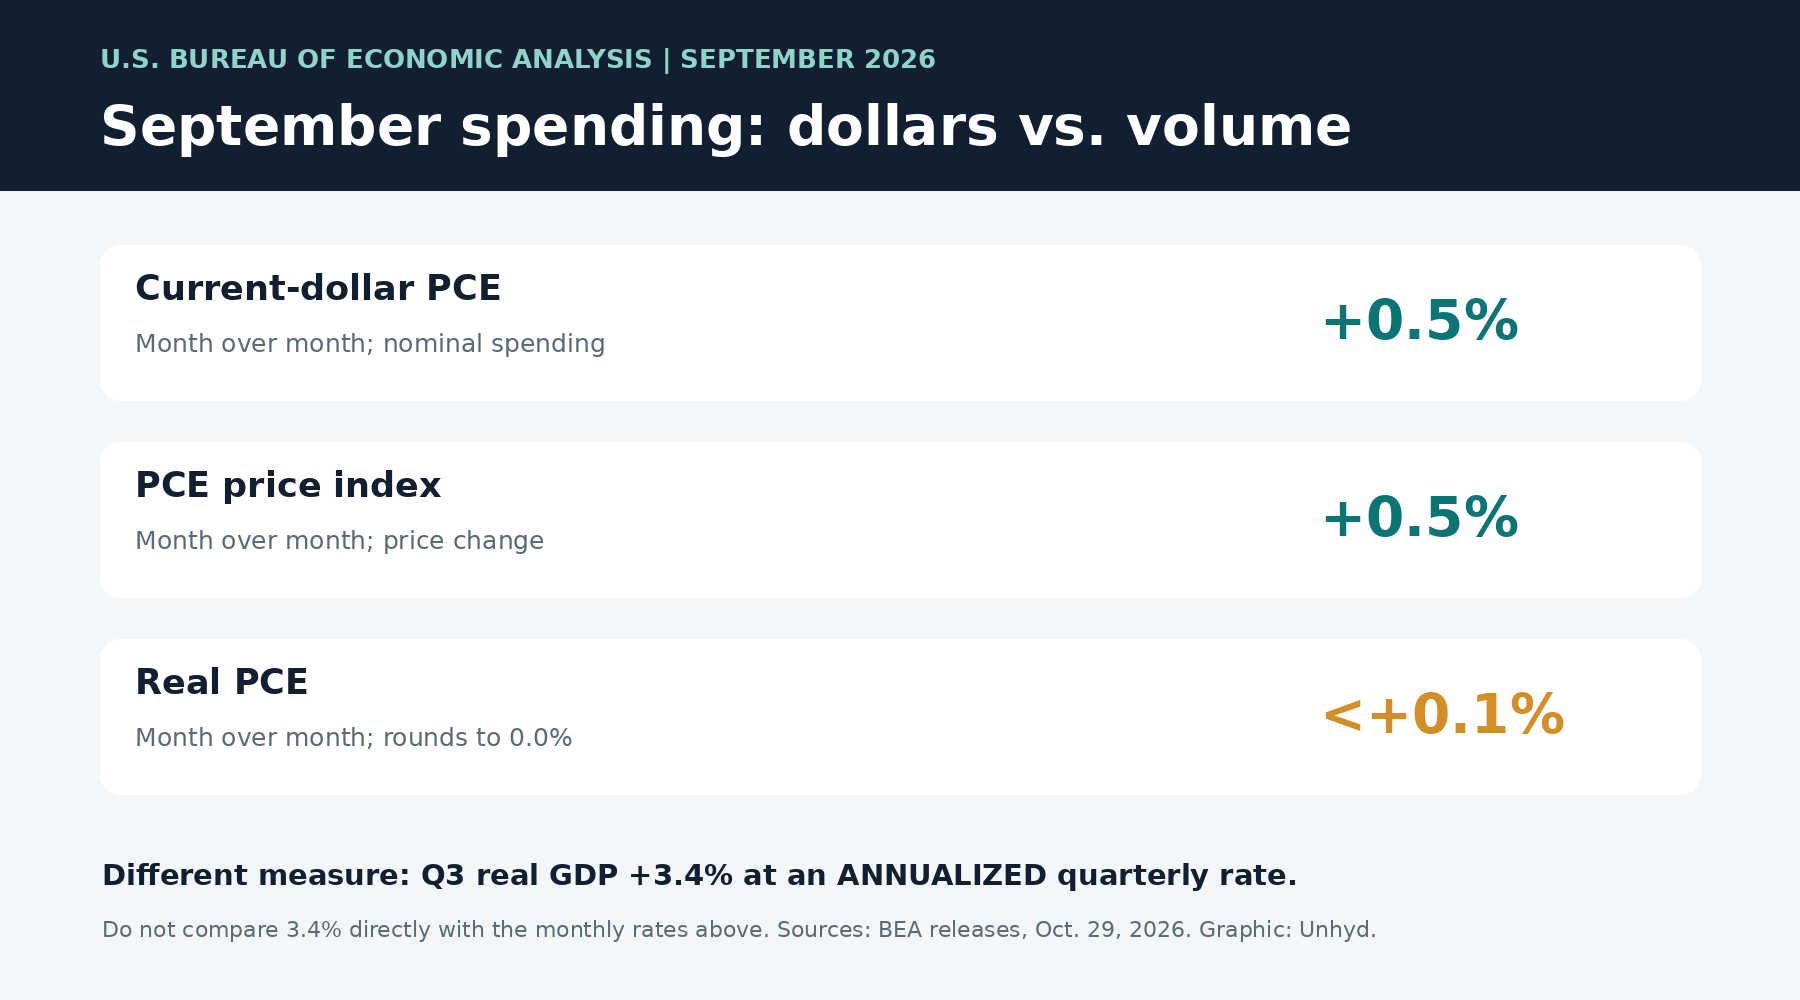
But the September PCE price index also increased 0.5%. BEA reports real PCE increased less than 0.1% during the month, displayed as 0.0% after rounding in its summary table. A household can spend more dollars while purchasing nearly the same inflation-adjusted volume of goods and services. That is the distinction the two nominal and real spending figures capture.
Do not subtract the two published rounded percentages and claim to have independently calculated an exact zero change in real spending. BEA computes real series from more detailed data and price adjustments. The rounded headline values merely illustrate why a 0.5% nominal rise should not be reported as a 0.5% increase in the quantity of goods and services consumed.
There is also a calendar issue: the third-quarter GDP estimate averages activity across July, August and September, while the monthly PCE release isolates the movement from August to September. A strong quarter can end with a softer month. The September reading cannot be used to reverse-engineer the entire quarter's contribution from consumption without the other monthly and quarterly data.
Three numbers that should not be placed on one scale
Put the releases side by side and three useful measurements emerge. Real GDP increased at a 3.4% annualized quarterly rate; September current-dollar consumer spending rose 0.5% month over month; September inflation-adjusted consumer spending rose less than 0.1% month over month. The first is economy-wide output, the second is nominal household consumption, and the third is real household consumption. Comparing the magnitudes directly would mix units and time windows.
A more defensible within-period comparison uses September's own monthly series. Nominal PCE growth was 0.5%; the PCE price index increased 0.5%; real PCE was essentially flat after rounding. This is not a statement that inflation caused every change in a household's budget. It is a national accounting result, and individual prices and purchasing patterns differ.
Income, savings and the limits of a national average
BEA says September personal income rose $54.5 billion, or 0.2%, while disposable personal income increased $52.7 billion, also 0.2%. In inflation-adjusted terms, real disposable personal income declined 0.3% from August. That is a meaningful difference: more nominal dollars did not translate into greater aggregate purchasing power in the monthly release.
The agency estimates personal saving at $911.1 billion and the personal saving rate at 3.8% in September. The saving rate is personal saving as a share of disposable personal income. It is not the percentage of households with emergency savings, the share of families saving exactly 3.8% of paychecks, or a measure of median household wealth. The dollar figure is a national-accounting annual-rate aggregate, not a cash pile available to an individual.
BEA's table reports August nominal PCE growth of 0.9% and real PCE growth of 0.5%, followed by September's 0.5% nominal and near-zero real readings. That is a slowdown in monthly spending growth. It is not proof that total real spending fell in September, and it does not establish a recession. Nor can two monthly observations identify which households reduced purchases.
What drove the quarterly GDP acceleration?
BEA says the acceleration from the second quarter primarily reflected faster investment growth and a turn upward in government spending, partly offset by a downturn in exports; imports also rose. Its technical notes identify private inventory investment and equipment as important contributors to investment growth. Information-processing equipment, including computers and peripherals, was a leading part of the equipment increase.
That equipment detail matters to a technology audience, but it is not a verified measure of artificial-intelligence spending. The category includes computers and peripheral equipment used for many purposes. The GDP release does not provide a company-level AI capital-expenditure ledger or show how much of the growth was caused by any particular technology company.
BEA also reports real final sales to private domestic purchasers rose at a 4.9% annual rate in the third quarter, compared with 4.6% in the second. That measure combines consumer spending and gross private fixed investment and excludes inventories and government purchases. It helps distinguish domestic private final demand from the more volatile inventory component, but it is not a measure of household spending alone.
The release's quarterly PCE price index increased at a 2.1% annual rate, while the September monthly PCE price index rose 0.5% and the September year-over-year PCE price index was up 3.6%. Those figures also use different windows. It would be wrong to claim that quarterly inflation of 2.1% disproves a September annual inflation reading of 3.6%; both can be correct under their definitions.
Why growth can coexist with weak consumer confidence
Unhyd's October consumer sentiment analysis found that survey respondents' views of current buying conditions weakened even as expectations improved somewhat. A survey about confidence is not a direct measure of actual GDP, and GDP growth does not invalidate what households report about affordability. One is an output statistic; the other is an attitude measure.
The same distinction appears in Unhyd's Federal Reserve family-finances analysis: higher median wealth can coexist with greater debt-payment strain. That report uses a different survey period and methodology, so its figures should not be added to BEA's September flows. The connection is interpretive: national expansion is not a household-level guarantee.
What this first estimate cannot establish
The GDP figure is an advance estimate, subject to revision as more complete source data arrive. BEA has scheduled its second third-quarter estimate for November 25, 2026. The September personal-income and outlays release also lists November 25 for the next monthly update. Those are the next dates to check, rather than treating today's numbers as permanently fixed.
Neither release identifies which families benefited from growth, how gains were distributed across income groups, or whether the latest month represents a durable trend. Nor do the two releases prove that spending was financed by debt, that households exhausted savings, or that AI investment caused GDP to accelerate. Those claims would require additional evidence beyond the figures published today.
The defensible conclusion is narrower and more informative. The U.S. economy expanded at a faster annualized real pace in the third quarter, while September's inflation-adjusted consumer spending and disposable income readings were notably softer than their nominal counterparts. Both statements can be true. Understanding the units, timing and composition is what turns two headlines into a useful picture of the economy.