

The Federal Reserve's 2025 Survey of Consumer Finances tells two stories at once: the typical U.S. family's inflation-adjusted income and net worth increased between the 2022 and 2025 surveys, but more families with debt reported falling behind on payments. The distinction matters because growing assets and the ability to meet next month's bills are not the same measure of financial health.
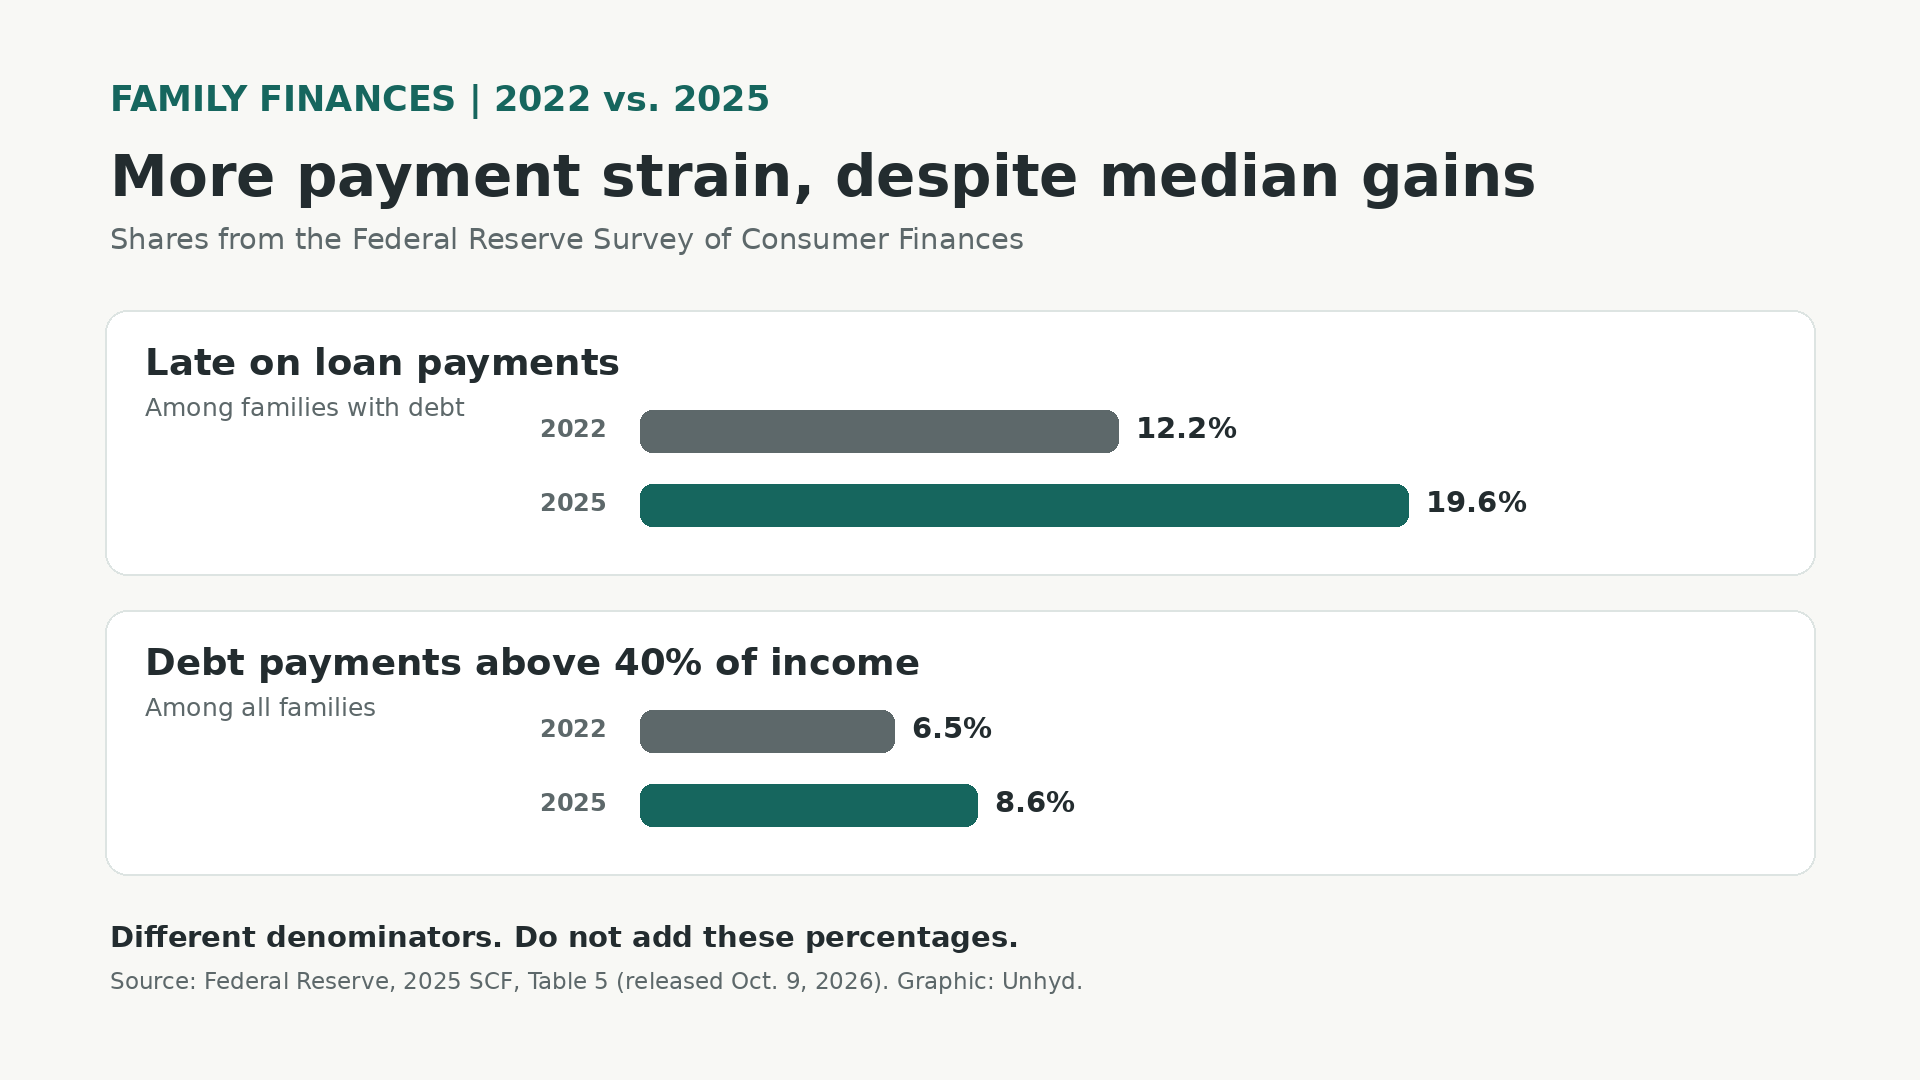
In results released on October 9, 2026, the Federal Reserve reported that real median family income rose 7% to $82,200 and real median net worth rose 2% to $215,900. Yet the share of indebted families reporting late loan payments rose from 12.2% to 19.6%. A separate measure—the share of all families whose debt payments exceeded 40% of income—rose from 6.5% to 8.6%. Those numbers come from different questions and populations, so they should be read side by side, not added together.
What the 2025 Survey of Consumer Finances actually measures
The Federal Reserve's October 9 announcement summarizes a nationally representative survey of U.S. families conducted every three years. Its accompanying 66-page research report compares 2022 and 2025 survey results, including income, assets, debt and credit experiences. The survey is not a live count of every American household's finances, and the latest report does not establish what happened to any one family in 2026.
Its dollar comparisons are expressed in 2025 dollars, adjusting for inflation. That makes the reported 7% rise in median income a real change, rather than simply the result of higher prices. Median means the midpoint of the distribution, not the arithmetic average. A rise in the median does not imply that every family became better off.
The survey's unit is the family, as defined in its methodology. That is not interchangeable with a count of individual adults, tax returns or people with credit cards. The survey's 2025 interviews were conducted mostly in 2025, with some in early 2026, according to its technical appendix. The results describe conditions over the survey period, not a forecast.
The debt-distress change is larger than the headline wealth gain
The most revealing comparison is not a subtraction of wealth from debt. It is the direction and scale of several indicators from the same Federal Reserve report. Table 5 shows that 12.2% of indebted families reported being late on loan payments in the 2022 survey, compared with 19.6% in 2025. That is a rise of 7.4 percentage points. Relative to the 2022 rate, the increase is approximately 60.7%: (19.6 − 12.2) ÷ 12.2 × 100.
For the separate measure of particularly heavy payment obligations, the share of all families with debt payments exceeding 40% of income rose from 6.5% to 8.6%. That is 2.1 percentage points, or a relative increase of approximately 32.3%: (8.6 − 6.5) ÷ 6.5 × 100. These relative changes are calculations from published, rounded survey estimates, not newly measured population statistics.
The two percentages have different denominators. The late-payment question concerns families with debt at the time of interview, while the high-payment-burden statistic is reported for all families. Neither is a percentage of all Americans. Combining them into a single “financially distressed” share would be unsound because the measures can overlap and are not based on identical populations.
Other figures point in the same direction without measuring the same problem. Among families carrying debt, the median debt-payment-to-income ratio rose from 13.4% to 15.4%, a 2-percentage-point increase. Meanwhile, the share reporting payments at least 60 days late rose from 4.9% to 8.2%. Each measure describes a different dimension of pressure, not a separate group to add to the others.
Why higher net worth does not guarantee easier monthly bills
Net worth is assets minus liabilities. It can increase when the market value of a home or investments rises, even if the family has little additional cash available to cover recurring bills. A homeowner can be wealthier on paper without having enough liquid savings to meet a loan payment; accessing home equity may require borrowing, selling or paying transaction costs.
The Fed reported that median family net worth rose 2% in inflation-adjusted terms to $215,900. Mean net worth—the average across families—rose 7% to $1.24 million. The difference between the mean and median matters because very large fortunes have a strong effect on the average. Neither figure is a bank balance, and neither describes the amount of cash the typical family can immediately spend.
The report also found that the fraction of families with any debt was about 77%, broadly unchanged from 2022. That helps explain why the more important change was not simply how many families borrowed, but whether the payment burden was becoming harder to manage for some borrowers. The Fed notes that assets can be illiquid and that income changes can affect debt-service ratios.
A simple hypothetical illustrates the distinction. Imagine a family's home equity rises by $20,000 while its monthly income stays fixed and required debt payments rise by $150. Its balance sheet has improved, but the household has $1,800 less cash flow available over 12 months, assuming no other changes. This is an illustration of accounting, not a claim about any survey respondent. It does not imply that home-equity gains caused the higher payments.
The difference between percentage points and percentages
Both are legitimate ways to describe change, but they answer different questions. Moving from 12.2% to 19.6% is an increase of 7.4 percentage points. Dividing that increase by the starting value gives roughly 60.7% relative growth in the measured share. Writing that late payments “rose 60.7 percentage points” would be false. Writing that 60.7% of indebted families were late would also be false.
That caution extends to comparing statistics across institutions. Unhyd previously examined why FTC and FBI fraud-loss totals cannot simply be added; the same underlying principle applies here. Before combining numbers, check who was counted, which period was measured and whether the categories overlap.
What the survey can and cannot say about causes
The Fed describes a period of elevated inflation and higher interest rates, along with moderate economic growth. Those conditions provide plausible context for household strain, but the summary statistics do not isolate a single cause for every late payment. They cannot establish that one particular interest-rate change, wage decision or household expense caused the observed difference between surveys.
The survey also does not follow the same families through time as a simple panel in which every respondent's trajectory can be traced. A change in a population median is not equivalent to the typical individual family's three-year gain. Differences in the mix of families and their circumstances matter when interpreting the distributions.
Independent coverage by Reuters and other financial outlets has emphasized the coexistence of wealth gains and increased debt stress. That corroborates the central reading of the Fed's release, but the calculations and denominators in this article are drawn directly from the official report rather than reconstructed from secondary headlines.
What a reader can usefully take from the findings
The practical lesson is not to treat national survey averages as a personal diagnosis. Someone evaluating their own finances should separate a balance-sheet snapshot—cash, savings, investments, home equity and outstanding debts—from monthly cash flow: take-home income, unavoidable expenses and required debt payments. A positive net worth figure does not, by itself, show whether a near-term payment is affordable.
When comparing recurring commitments, calculate their cost over a consistent period. Unhyd's guide to comparing internet plans demonstrates that method for household bills: promotional prices, recurring fees and renewal terms can alter the amount actually paid. The principle is broader than telecommunications, although the specific financial risks differ by product.
The 2025 Survey of Consumer Finances is a substantial source for understanding U.S. family balance sheets. Its most important warning is about interpretation: modest real gains at the median can coexist with a markedly higher share of indebted families reporting payment problems. Both findings are true within their stated definitions. Neither should erase the other.