Microsoft and Alphabet earnings released on October 28 show how differently the AI infrastructure boom can appear on two companies' cash-flow statements. Both reported rapid cloud growth for the quarter ended September 30, 2026. But Microsoft's operating cash exceeded its cash purchases of property and equipment by about $18.6 billion, while Alphabet's equivalent calculation was negative $9.1 billion.
The contrast is real, but it is not a verdict on which company has the better AI strategy. Free cash flow is a useful checkpoint for financing pressure; it is not a direct measure of an individual data center's profitability, a cloud customer's return on AI, or the long-term value of a newly built computing facility.
What Microsoft and Alphabet earnings actually reported
Microsoft's fiscal 2027 first-quarter release reported $92.3 billion in revenue, up 19% from a year earlier. Azure revenue increased 48% to $33.165 billion, and Microsoft Cloud revenue, a broader grouping, reached $63.9 billion. Those are different measures; Microsoft Cloud includes more than Azure.
Alphabet's third-quarter filing exhibit reported $127.6 billion in revenue, up 25%. Google Cloud revenue reached $30.709 billion, a 103% increase from the comparable 2025 quarter. Alphabet attributed that expansion to AI infrastructure, AI solutions, core cloud services and sales of its TPU systems.
The two companies use different fiscal-year labels for the same calendar quarter. Microsoft's fiscal Q1 2027 and Alphabet's Q3 2026 both cover July through September 2026. That makes the cash-flow periods directly comparable in time, although business mix, accounting choices and infrastructure arrangements still differ.
The cash-flow comparison: $18.6 billion versus minus $9.1 billion
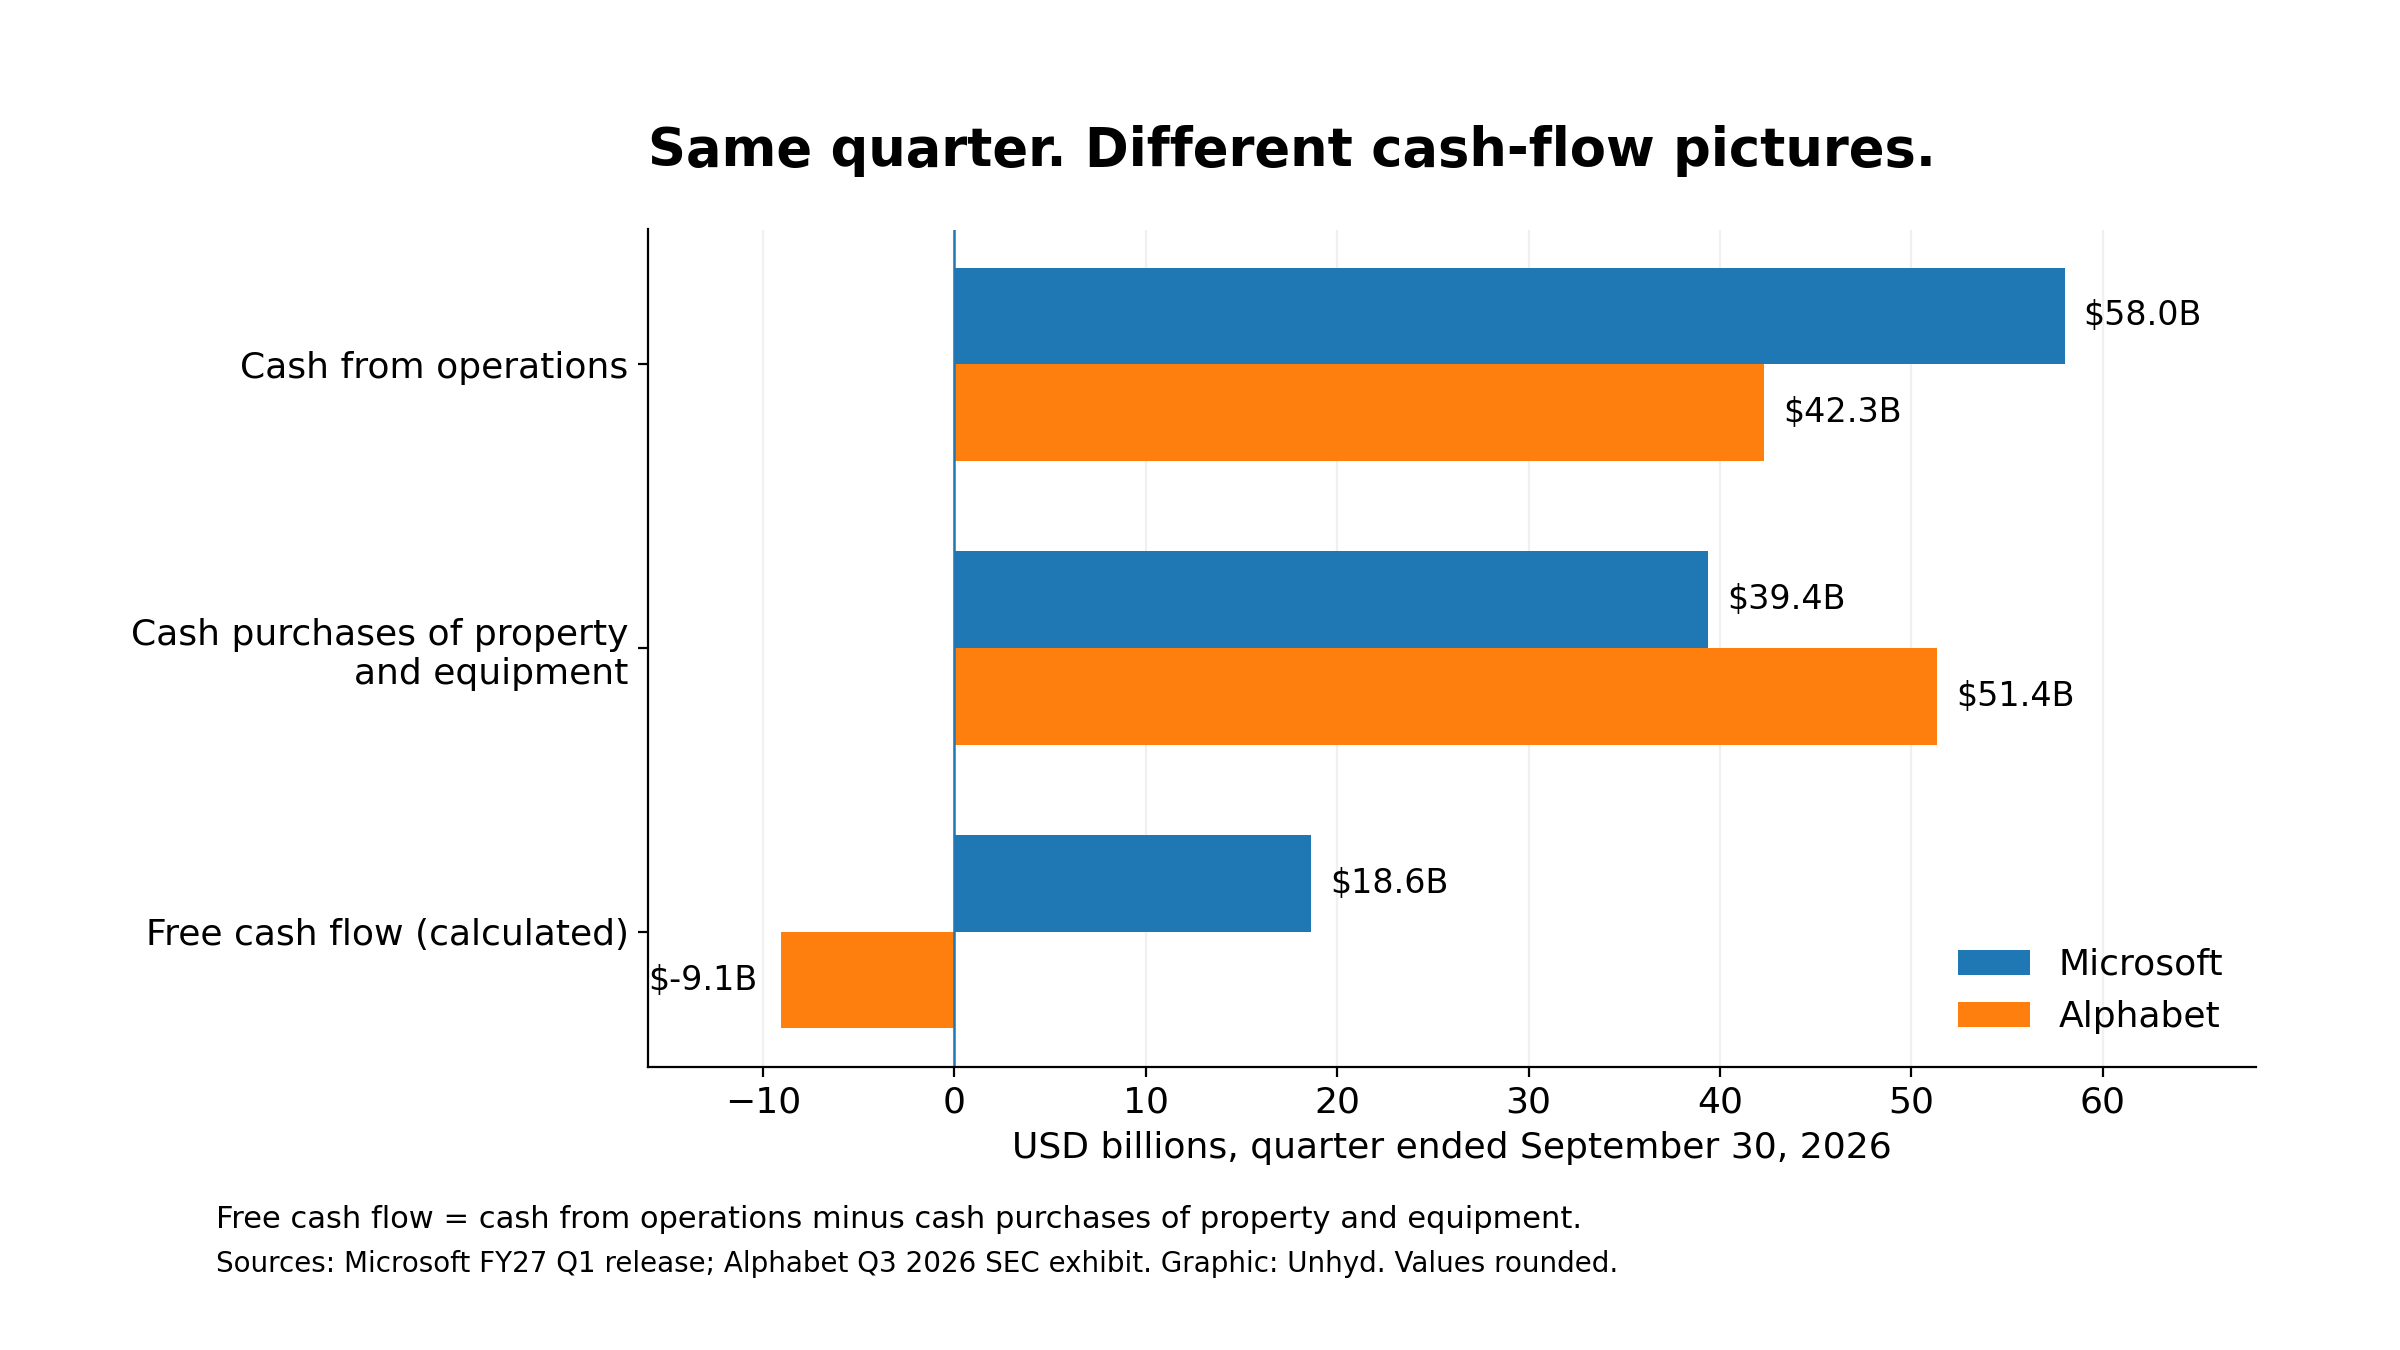
Microsoft reported $58.000 billion of net cash from operations and $39.367 billion of cash additions to property and equipment. Subtracting the second from the first yields $18.633 billion of free cash flow under that simple cash-based definition. Alphabet reported $42.290 billion of operating cash and $51.355 billion of property-and-equipment purchases, producing negative $9.065 billion. Alphabet explicitly publishes the latter figure in its free-cash-flow reconciliation.
That is a $27.698 billion gap between the two reported quarter-end cash-flow measures, calculated from the disclosed figures. It does not mean Microsoft earned $27.7 billion more in profit. Free cash flow is calculated from cash movements after certain investment spending; profit follows accounting rules that recognize revenues and expenses on a different basis.
There is another distinction. Microsoft executives discussed approximately $45.2 billion of quarterly capital expenditure, a figure that includes investment components beyond the $39.367 billion cash property-and-equipment line used in the chart. Mixing that broader spending figure with a cash-flow calculation without explaining the difference would misstate free cash flow. The visual below consistently uses cash-flow-statement lines for both companies.
Cloud growth does not equal cash available today
Microsoft's Azure growth and Alphabet's Google Cloud growth both signal strong demand, but a 48% growth rate and a 103% growth rate do not reveal which service is more profitable or efficient. The businesses start from different revenue bases, include different products and recognize infrastructure costs in different places.
Alphabet reported Google Cloud operating income of $11.121 billion, compared with $3.594 billion a year earlier. That is evidence of substantial segment profit growth even while company-wide quarterly free cash flow was negative. It is possible for a fast-growing business to report operating profits and still spend more cash on equipment than it generates from operations in a particular period.
Microsoft's cloud performance also sits inside a broader company that sells enterprise software, devices, advertising and other services. Its $677 billion commercial remaining performance obligation is a contracted-revenue measure, not cash collected this quarter or a guarantee that every obligation will convert into revenue on the same schedule.
Why the investment cycle matters
AI infrastructure requires upfront spending on servers, chips, networking, power systems and facilities. Revenue may arrive over years as capacity is delivered and used. That timing can produce large differences between current cash flow and management's expectations of future returns.
In independent reporting, Reuters said Microsoft attributed some capital-spending shortfall against its own forecast to delayed third-party capacity deliveries. A lower-than-forecast expenditure number therefore should not automatically be interpreted as a strategic decision to slow AI investment.
Alphabet's negative quarterly free cash flow also needs context. Its filing lists $265.098 billion in cash, cash equivalents and marketable securities at September 30. A negative free-cash-flow quarter does not, by itself, mean the company has run out of money. The more useful question is how spending, financing and returns evolve across several quarters.
Unhyd has previously examined NVIDIA's AI infrastructure revenue as evidence of hardware demand. That supplier-side measure helps show where money is going. The Microsoft–Alphabet comparison asks a different question: how much operating cash the major buyers retain after paying for the infrastructure they are building.
Three numbers to watch next quarter
First, track operating cash flow alongside revenue growth. A company can expand sales quickly without a matching improvement in cash generation if collections, expenses or working capital move differently. Second, track actual cash equipment purchases, not only broad capital-spending commitments or long-range projections. Third, watch free cash flow over several quarters rather than extrapolating one negative or positive reading indefinitely.
It also matters how efficiently new infrastructure is used. Unhyd's reporting on Microsoft's Maia 300 roadmap explains why computing output per unit of electricity is one operational measure worth following. But neither company's latest earnings release supplies a common, audited measure of AI revenue generated per dollar of newly installed computing capacity.
The central lesson from these earnings is narrower and more useful than declaring an AI winner. Microsoft and Alphabet are both showing substantial demand for cloud services. Their cash-flow statements show that the cost and timing of building the next generation of infrastructure can create very different financial pictures in the same quarter. Whether those differences persist is the story to follow.