Data center water use is often described with a single dramatic number. Yet a figure for water consumed inside a computing facility, a national estimate of water used to generate its electricity, and a company's water-replenishment claim answer three different questions. Put them side by side without checking the boundaries, and an otherwise accurate statistic can create a misleading comparison.
The distinction matters as artificial intelligence expands demand for computing infrastructure. A data center must remove heat from its equipment, but the water associated with that task may be consumed at the site, at a power station supplying the site, or earlier in the equipment supply chain. The most useful analysis starts by asking where the water is counted, what is measured and which year the estimate describes.
What data center water use actually measures
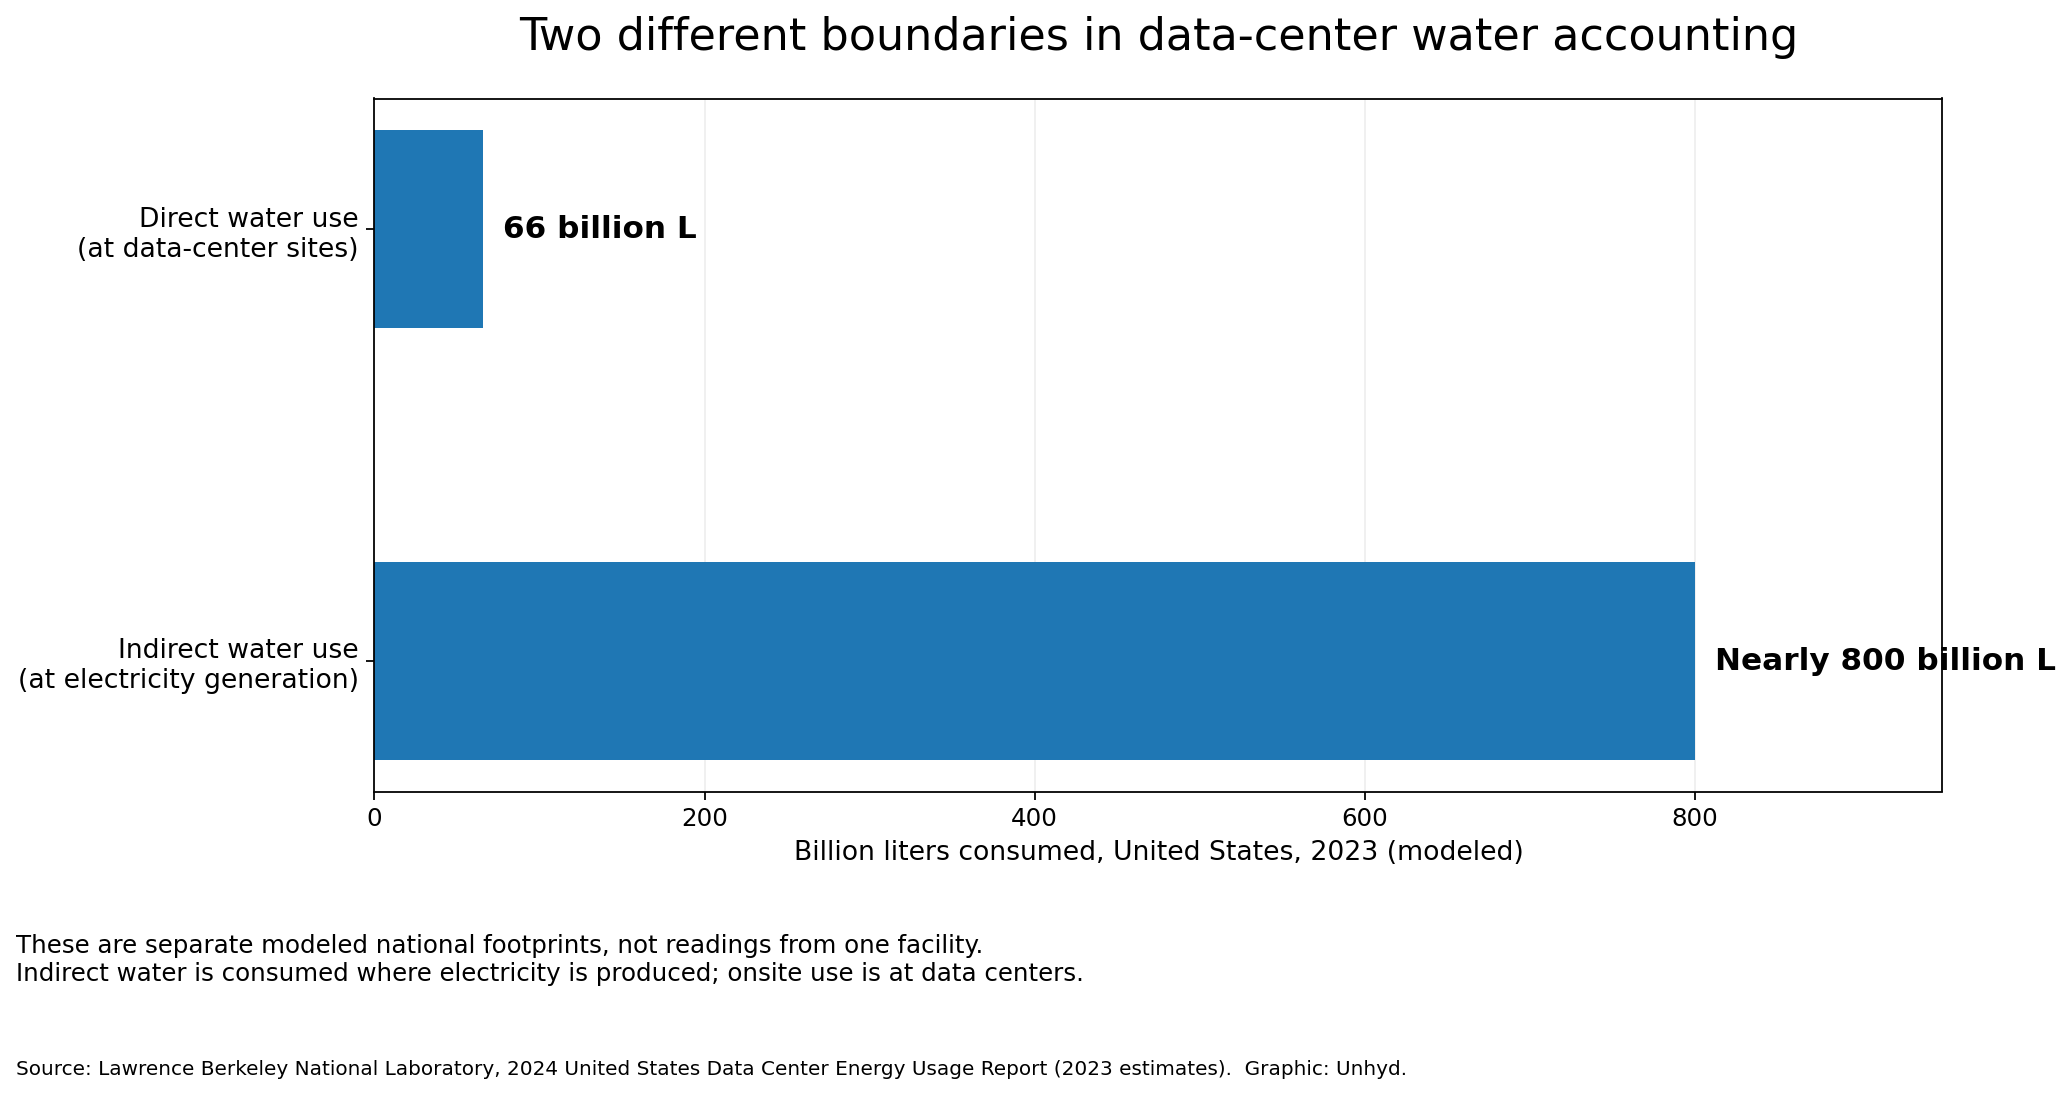
In its 2024 United States Data Center Energy Usage Report, Lawrence Berkeley National Laboratory estimated that US data centers directly consumed about 66 billion liters of water in 2023. Direct consumption is associated with operations at the facility, principally cooling. The figure covers the US data-center fleet, not just AI-specific workloads, and comes from modeling rather than a census of every site's water meter.
The same research estimated a much larger indirect water footprint of nearly 800 billion liters for the electricity that US data centers used in 2023. That water is consumed in the energy system, rather than piped into the data center. The distinction is especially important when a facility draws power from a regional grid whose generation mix differs from the mix serving another site.
Dividing nearly 800 by 66 gives a ratio of approximately 12 to one. This is Unhyd's arithmetic from the laboratory's rounded national estimates, not a newly measured facility result. It illustrates why a headline about onsite cooling can describe only one part of an operational water footprint. It does not mean that any particular data center uses twelve times more water offsite than onsite.
Water withdrawal is not the same as water consumption
Another boundary is easy to miss. Water withdrawal refers to water taken from a source, including water later returned. Water consumption refers to the portion not returned to that source, often because it evaporates. A facility that withdraws water for a cooling process may return some of it; the two figures should not be used interchangeably.
The International Energy Agency's Energy and AI report explicitly separates withdrawals and consumption. It also distinguishes water used for onsite cooling, electricity and primary energy supply, and semiconductor manufacturing. A broader lifecycle estimate is not directly comparable to a company's onsite operational number, even when both are expressed in liters or gallons.
For perspective, the IEA's 2025 analysis estimated that an illustrative 100-megawatt hyperscale data center in the United States consumes around two million liters per day in total, with more than 60% attributed to indirect use. That is a modeled illustration, not a verified reading from a named facility. Cooling technology, operating load, climate and the electricity mix can all change the result.
Why the same cooling decision can shift water use elsewhere
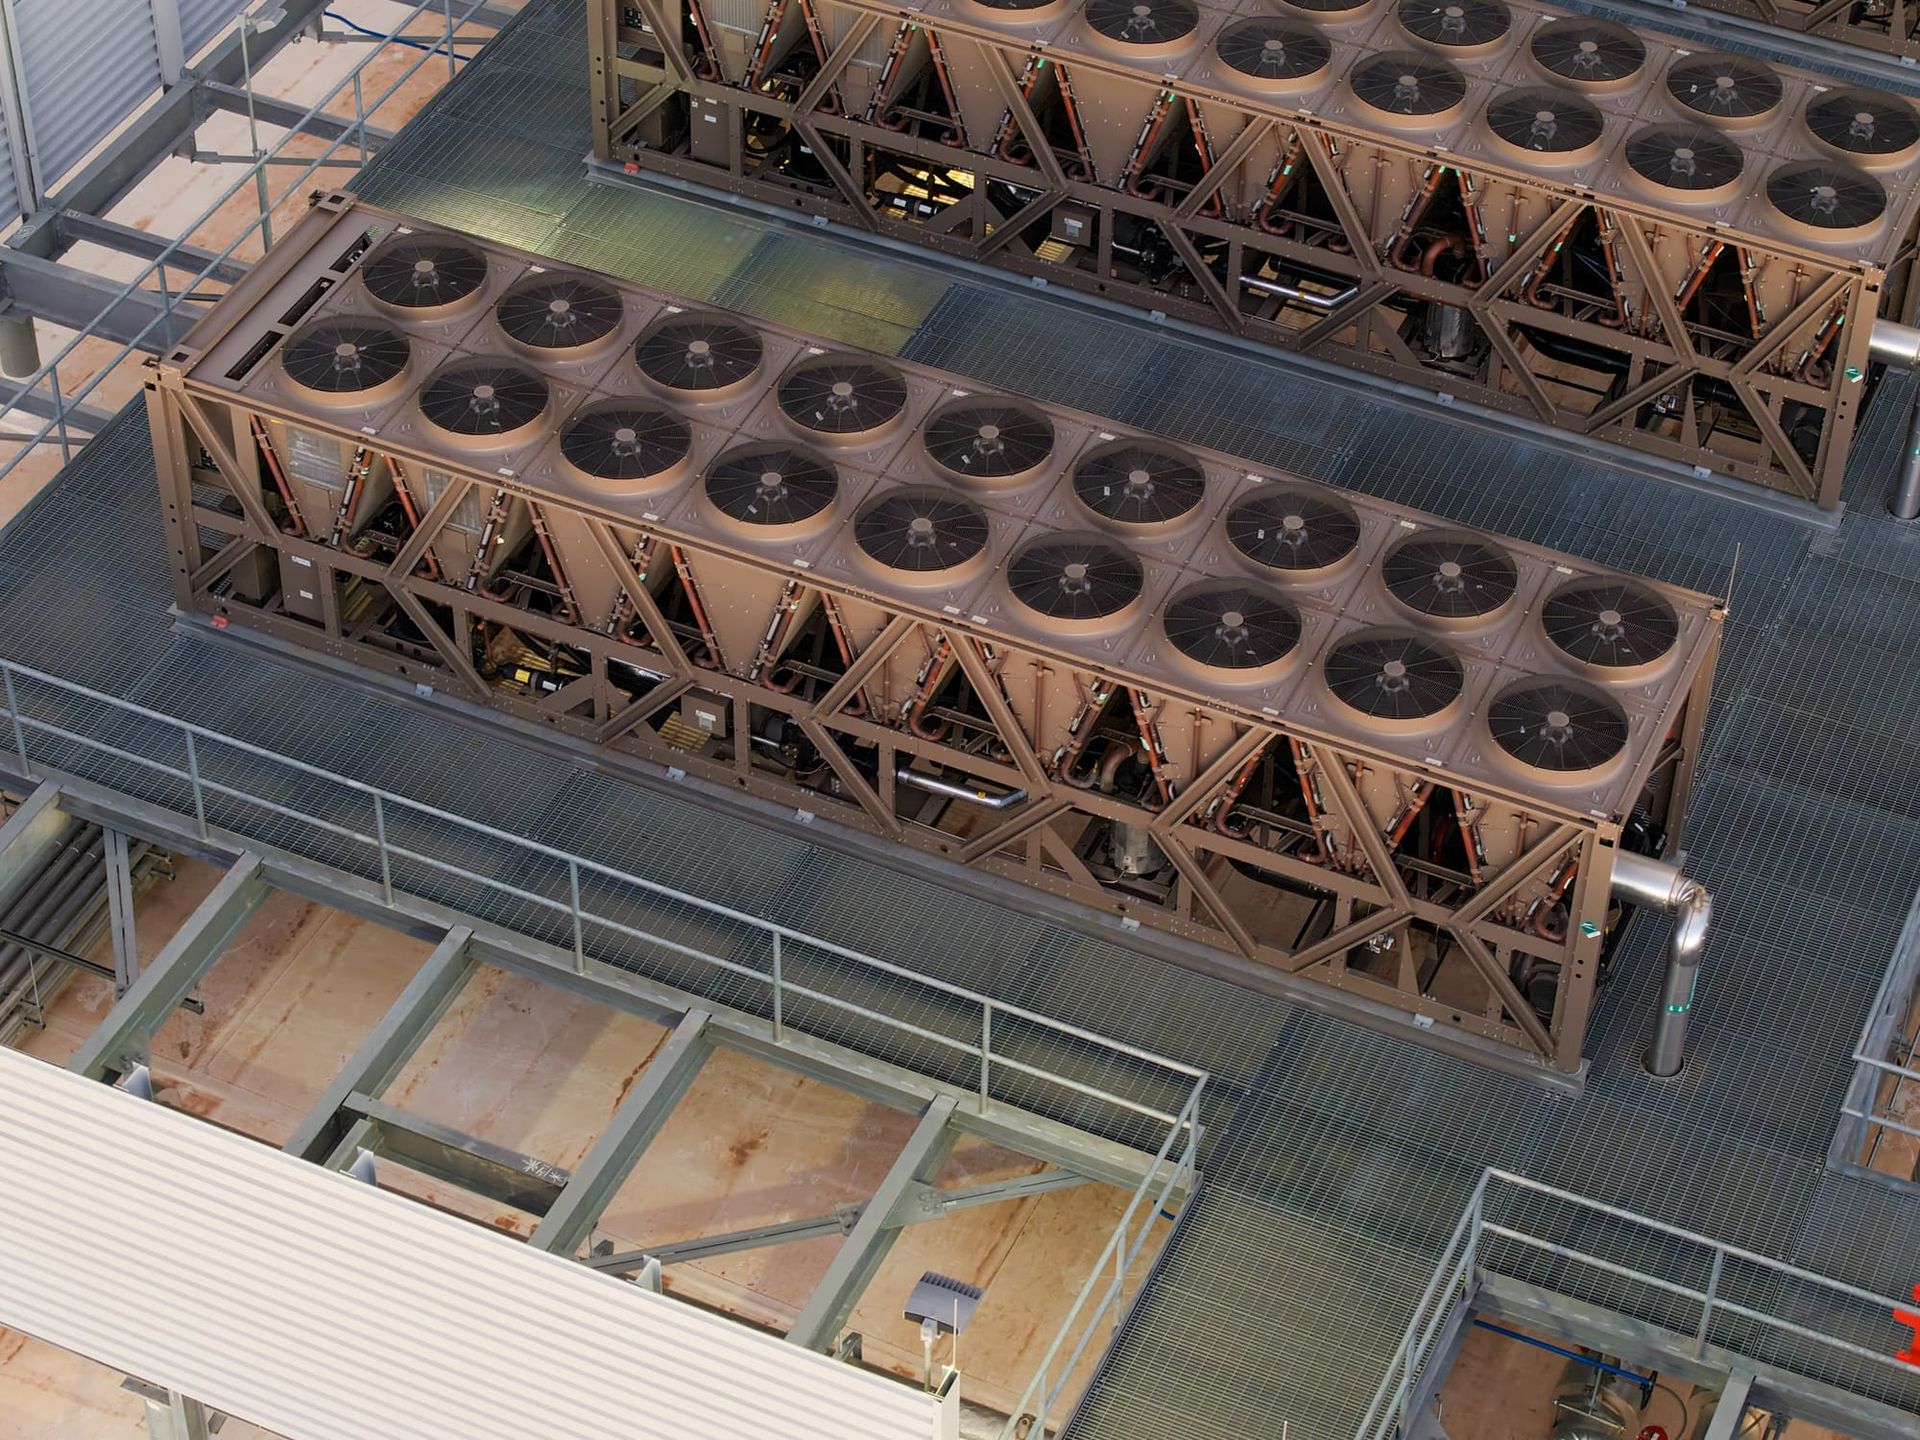
Data centers reject heat in different ways. Evaporative systems can save electricity in some operating conditions while consuming water onsite. Air-based or other low-water approaches can reduce direct water demand, but their electricity requirements vary with design and weather. Liquid cooling, meanwhile, describes how heat is collected and moved within a system; it does not by itself establish whether the facility's final heat rejection consumes water.
That creates a trade-off, not a universal ranking. A proposed cooling system should be evaluated for both onsite water and power demand under realistic local conditions. If a design reduces evaporation at the facility but raises electricity use, its indirect water impact depends on the actual power supply. Conversely, a more efficient power system may lower upstream water consumption without changing the cooling tower outside the building.
The distinction also connects to Unhyd's coverage of data center electricity forecasts. Electricity projections describe a growing demand challenge, but they are not themselves water forecasts. Converting megawatts into water use requires additional assumptions about load, cooling, location and generation.
What Google's 2026 water disclosure does—and does not—tell us
Corporate sustainability disclosures add a different measurement problem. In its 2026 Environmental Report, Google says water-stewardship projects replenished approximately 7.7 billion gallons in 2025, representing about 78% of its total freshwater consumption for that year. The company says its portfolio included 165 projects spanning 97 watersheds.
Those figures describe Google's own reported stewardship accounting. They are not a measurement of water returned to the same source, at the same moment, as every liter consumed by a data center. Nor is a replenishment percentage the same metric as the onsite water-use efficiency of an individual facility. The company's report also covers a broader operational context than the US-only national model from Berkeley Lab, so the figures should not be placed in a league table as though they share identical scope.
A fair reading recognizes both what the disclosure adds and what it leaves open. It shows that the company is reporting a growing portfolio of water projects and a quantified replenishment claim. Evaluating local impact still requires watershed-level context: the source of the water, seasonal availability, competing demand, and the timing and durability of claimed benefits.
A practical test for comparing two water headlines
Before concluding that one data center or company is more water-efficient than another, put the disclosures through five questions.
- Boundary: Does the number cover onsite cooling, electricity generation, manufacturing, or several stages combined?
- Metric: Is it withdrawal, consumption, water-use efficiency, or a replenishment claim?
- Geography: Is the figure for one facility, a regional fleet, a national model, or global operations?
- Period and evidence: Is it a measured annual result, a modeled historical estimate, or a future scenario?
- Local consequence: What does the figure imply for the particular watershed, utility and community?
These questions are not a way to dismiss the water demands of AI infrastructure. They are a way to make the debate more precise. A low national average can conceal stress at a specific location, while a large global number can obscure whether a project is drawing on scarce freshwater or using a different supply arrangement.
Why a water claim needs a location, not just a gallon figure
Water availability is local in a way that many corporate disclosures are not. A cooling system that works acceptably in one climate may perform differently during a hotter season or in a watershed already facing competing demands. Even a well-sourced annual total may be insufficient for a utility planning around peak-day water demand.
Power planning can complicate that picture. Unhyd recently reported on Google's nuclear-power agreement with Constellation, which concerns planned additional generation capacity. That type of electricity arrangement is relevant to the broader infrastructure conversation, but it does not establish the onsite water consumption of a particular data center or prove a watershed benefit. Energy procurement and water accounting need their own evidence.
The strongest public reporting would identify each facility's cooling design, water source, annual consumption and withdrawal, peak demand, electricity sourcing, and the methodology behind any offset or replenishment claim. Without those details, a comparison should be framed as incomplete rather than definitive.
The takeaway
The available evidence supports a clear conclusion: data center water use cannot be responsibly reduced to one universal gallons-per-server or gallons-per-AI-query number. Berkeley Lab's US model, the IEA's broader accounting, and Google's corporate disclosure illuminate different parts of the system. Their figures are useful precisely when their boundaries remain visible.
As AI infrastructure grows, the most informative question will not be which headline contains the largest number. It will be whether operators and policymakers disclose enough comparable, location-specific information to show what water is consumed, where the burden falls, and what practical choices could reduce it.