A data center electricity forecast can sound like a prediction carved in stone: a certain number of power plants, a fixed share of the grid, a deadline by which artificial intelligence will consume a startling amount of energy. The latest detailed U.S. modeling makes a different point. It offers a range of possible outcomes shaped by how many computing systems are installed, how intensively they run and how efficiently facilities cool them.
In its 2025 data-center energy update, published in June 2026, Lawrence Berkeley National Laboratory estimates 649 terawatt-hours (TWh) of annual U.S. data-center electricity use in 2030 under its reference case. Its compounded uncertainty scenarios span 521–843 TWh. Those figures are modeled future consumption, not electricity already consumed or capacity already connected to the grid.
The distinction matters to households, utilities and investors alike. A projection can justify planning for infrastructure, but it cannot tell a resident exactly how much their bill will rise or establish that every announced data center will be built.
What the 2030 data center electricity forecast actually says
The laboratory's reference case corresponds to about 11.8% of projected U.S. electricity consumption in 2030. Its wider scenarios imply approximately 9.5% to 15.3%. These percentages describe the modeled share of nationwide electricity use, not the share of generating capacity, the fraction of a local utility's load, or electricity consumed solely by generative AI.
The central figure is not a measured 2030 outcome. Berkeley Lab describes a bottom-up model built from expected shipments and installations of information-technology equipment, estimates of annual electricity use per device, cooling-system simulations, and assumptions about facility types and locations. Each input is consequential. A server that ships but never operates as anticipated, or a system that uses more power while idle, changes the result.
In the same report, changing individual assumptions produces different 2030 estimates: 578 TWh when projected equipment installations are lower, 664 TWh when specialized graphics-chip installations are higher, 590 TWh with shorter assumed AI-chip lifetimes, and 782 TWh with higher AI-server idle power and utilization. The 521–843 TWh endpoints come from combined uncertainty scenarios, not a simple selection of the lowest and highest single-variable examples.
The original comparison: a 322 TWh uncertainty gap
Subtracting the low compounded scenario from the high one gives 322 TWh of annual electricity use. That is an arithmetic comparison of the report's two 2030 scenarios, not an estimate of additional consumption between two years. The spread is roughly half of the 649 TWh reference case. In other words, the modeling uncertainty is material enough to affect long-term decisions about transmission, generation and demand management.
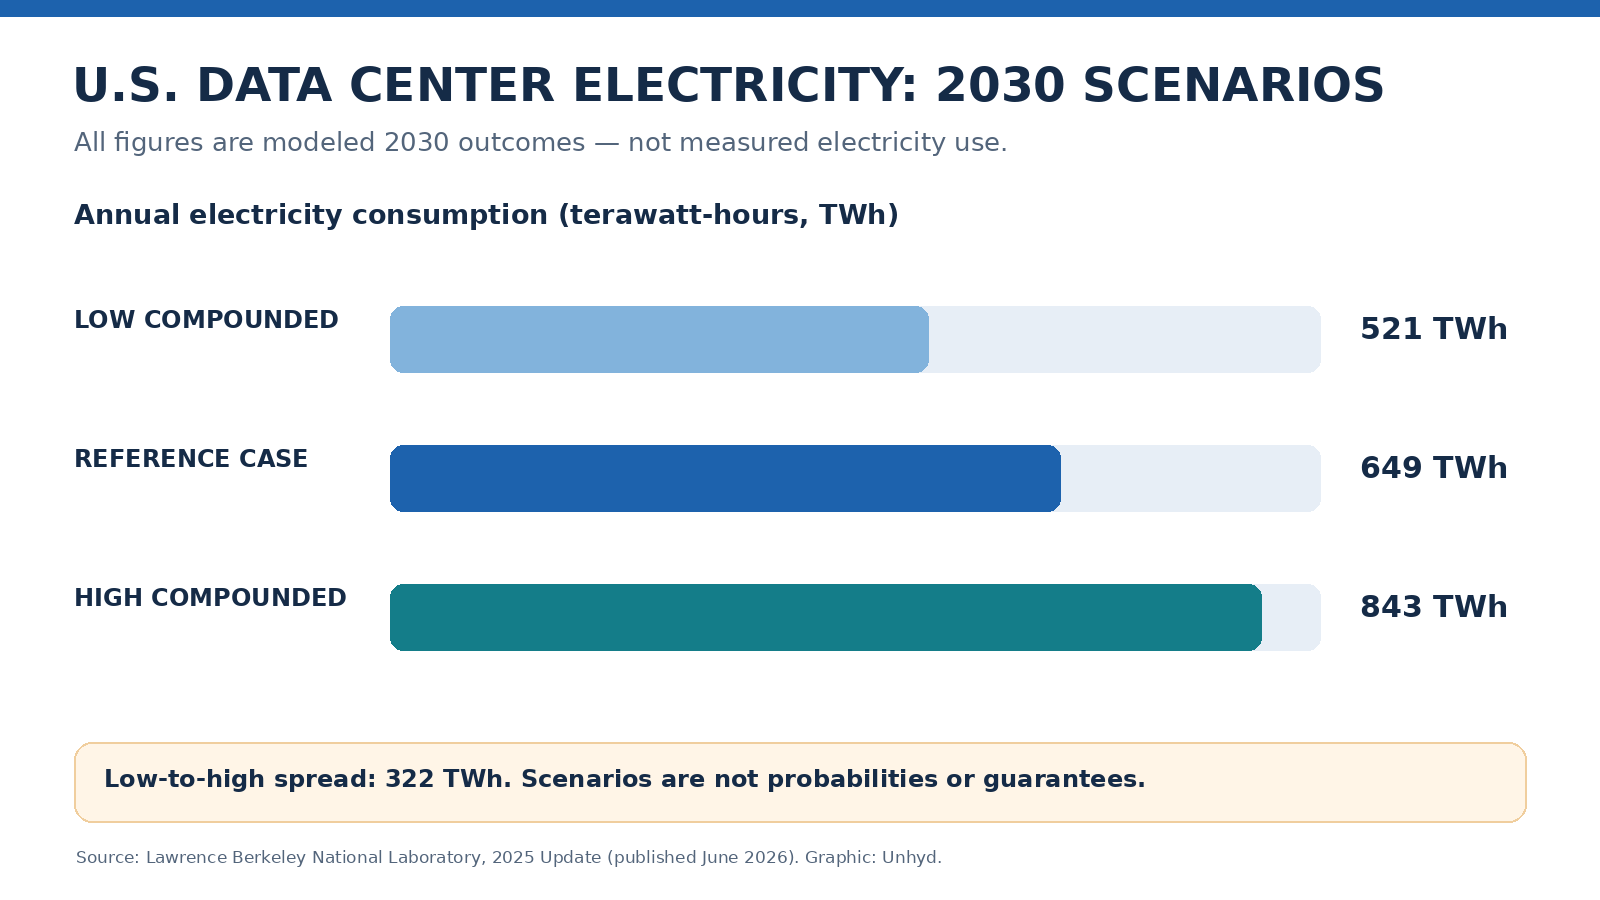
It would be misleading to treat the endpoints as a statistical confidence interval or assign either one a probability. Berkeley Lab describes scenarios built around different assumptions; it does not present a guaranteed range for the actual 2030 outcome. A forecast is useful precisely because it exposes what would need to be true for different outcomes to occur.
The earlier 2024 Department of Energy summary estimated 176 TWh in 2023 and a 325–580 TWh scenario range for 2028. The newer 2030 estimate is not a simple extension of that chart. It has a later target year and revised assumptions. Comparing the two reports as though they were observations from the same year would conceal both changes.
Why an electricity forecast is not a data-center construction schedule
Three measurements frequently collapse into one another in coverage of AI infrastructure: electricity consumption in TWh, electrical demand or capacity in megawatts or gigawatts, and the nameplate capacity of a proposed campus. They answer different questions. A megawatt describes a rate of power use; a terawatt-hour describes energy accumulated over time. A planned gigawatt-scale development does not necessarily operate continuously at that level, and it may not open on its announced timetable.
Unhyd's reporting on Applied Digital's proposed Finnish campus illustrates the difference between potential power access and a functioning facility. Likewise, its coverage of Microsoft's Maia 300 infrastructure plans distinguishes expected efficiency gains and deployment targets from measured production results.
Electricity-system planners must also consider geography. National annual consumption can rise while the most difficult constraints appear in a few local transmission corridors or substations. Two data centers with the same annual energy use may create very different grid challenges if one can shift work away from peak hours and the other requires uninterrupted peak capacity.
What AI efficiency can—and cannot—settle
More efficient chips and cooling equipment can reduce the energy needed for a given computing task. But if the cost of providing that task falls, demand for AI services may grow. Neither outcome should be assumed to cancel the other. Total electricity use depends on the interaction among efficiency, installed equipment, utilization and customer demand.
Berkeley Lab's model is particularly useful because it does not equate every data-center watt with an AI request. Data centers also run cloud storage, business software, streaming, networking and other services. An estimate for the entire data-center sector should not be relabeled an estimate for AI alone.
For a separate international perspective, the International Energy Agency's Energy and AI report examines global data-center demand and its implications for electricity systems. Its worldwide figures should not be added to or directly compared with Berkeley Lab's U.S.-only projections as though the models had identical geographic scope, baselines and methods.
Why power contracts matter, but do not close the gap
Some technology companies are signing long-term agreements intended to bring more electricity onto regional grids. Unhyd recently examined Google's agreement supporting nuclear reactor upgrades, which involves planned additions to grid capacity rather than proof of immediate delivery. Such agreements can create incentives for investment, but projects still face construction, regulatory and transmission constraints.
It is also important to distinguish a national demand projection from a forecast of household rates. Whether new large loads affect a particular customer's bill depends on utility tariffs, who pays for upgrades, local generation and transmission costs, regulation, timing and other demand. A nationwide TWh estimate alone cannot resolve those questions.
Five questions that make the next AI-power headline more useful
- Is the number measured or modeled? Historical electricity use, future scenario estimates and company targets should be labeled differently.
- What is the unit? TWh of annual energy cannot be compared directly with GW of peak power without assumptions about hours and utilization.
- Which geography and year? U.S. and global figures, or 2028 and 2030 scenarios, are not interchangeable.
- What assumptions drive the range? Equipment shipments, chip utilization, cooling and project delays may matter more than the headline midpoint.
- Who bears the local cost? A national forecast does not identify which customers pay for a particular grid upgrade.
The strongest conclusion is neither that AI's electricity demands are imaginary nor that a specific 2030 outcome is inevitable. The laboratory has documented a substantial potential increase and an unusually wide set of plausible modeled outcomes. Responsible planning should take the scale seriously while keeping the uncertainty visible. That is the difference between using a forecast as evidence and turning it into a prophecy.